
How to Compare Two Teams Head to Head: A Five-Step Method
By Betty Sports · · 7 min read
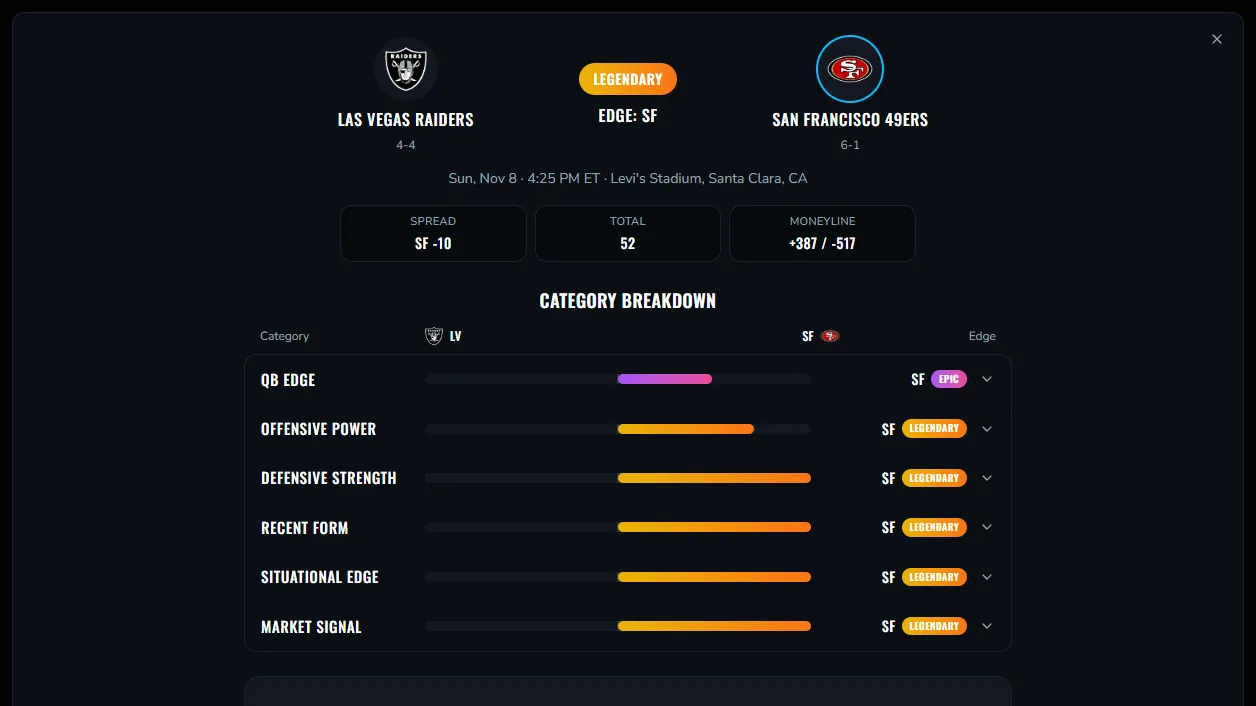
To compare two teams head to head, split the game into a few categories that matter, put both teams' numbers side by side, measure how far apart they are in each one, then weigh context like rest and weather. Finish by asking what could flip the result. That order keeps one flashy stat from running the show.
Most people compare teams by feel: records, a recent highlight, a name. A method does not make you right every time, but it makes you consistent, and it exposes your blind spots. Here is a five-step process you can use on any game, then a look at how Betty automates it.
Step 1: Which categories should you compare?
Pick the handful of areas that decide the sport, and use the same ones every time. If you compare six things for one game and eleven for the next, you will drift toward whatever supports your gut.
Each sport has its own shape. In football, the quarterback, the offense, the defense and recent form carry most of the weight. In baseball the starting pitcher dominates a given night. In a fight, striking and grappling are different games. Betty fixes this at six categories per sport, which is a useful discipline even if you build your own sheet.
Step 2: How do you put the stats side by side fairly?
Compare rates, not totals, and keep the direction of each stat straight. Points per game is better when higher; points allowed is better when lower. Mixing those up is the most common spreadsheet mistake, and it can flip a whole category.
Match samples too. A team's season average and its last four games answer different questions. Show both, and say which one you are leaning on.
Step 3: How big is the gap in each category?
Direction alone is not enough. Knowing a team is better at defense says nothing about whether it is slightly better or far better. Measure the size of the difference, because a small edge in many places can matter less than a huge edge in one.
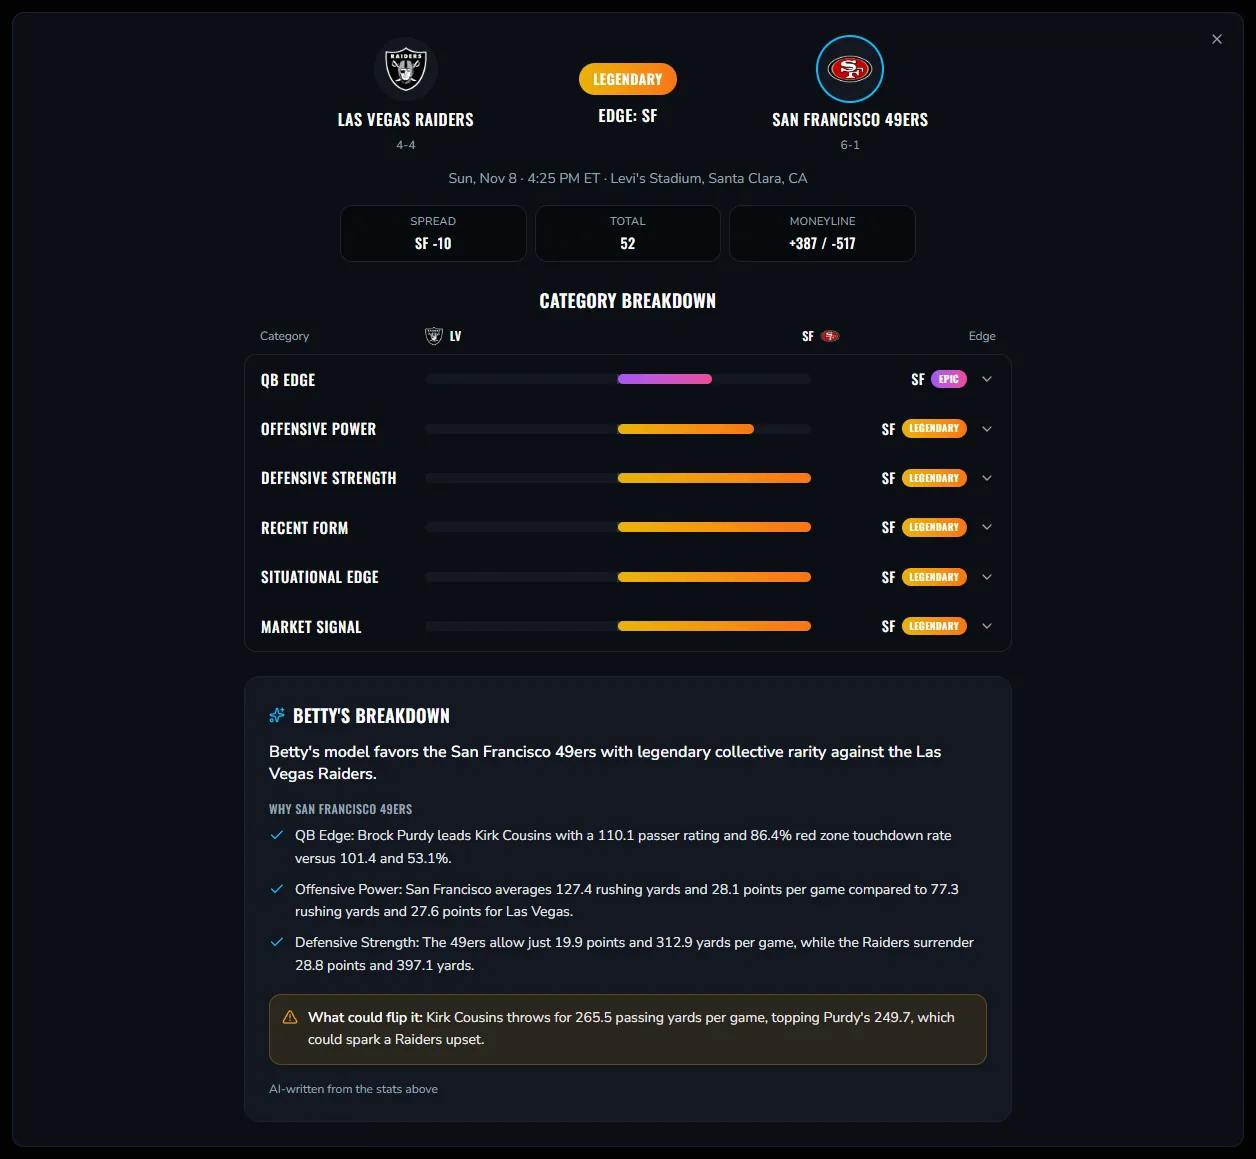
Betty shows the size of each category edge as a bar that grows toward the winning side, or no bar at all when the sides do not separate, and keeps Legendary, Epic and Rare for the overall verdict. You can borrow the same idea with a pencil. Mark each category as large, medium, small or none, and you will see the shape of a matchup in seconds. The ratings have their own post: what Legendary, Epic and Rare mean.
Step 4: What context changes the picture?
Raw stats ignore the circumstances of one particular game. Check rest days, travel, home field, who is in net or under center, and the weather for outdoor sports. A team on a back-to-back is not the same team that produced its season averages.
This is also where betting markets belong. The spread, total and moneyline are a read from the market, and they can confirm or contradict your own numbers. Betty treats them as one of the six categories, called Market Signal, rather than as the answer.
Step 5: What could flip the result?
End every comparison by naming the single thing most likely to make you wrong. A quarterback who throws a lot of deep balls into a strong secondary, a goalie who has been outperforming his shot-quality, a fighter who has never been taken down. If you cannot name a risk, you have not looked hard enough.
How does Betty run this method for you?
Open a game on Betty and the five steps are already on screen. The category bars show the gap in each area, the badge on each row shows its size, the top of the panel gives the collective verdict, and the context sits inside the Situational Edge and Market Signal rows. Underneath, the AI breakdown states the takeaway, three reasons and what could flip it.
Because every row expands into the actual stats, you can disagree with a category and still use the rest. That is the point of a head-to-head view: you can see who compares to who, how, and where, without building a spreadsheet.
How much data is enough?
Less than you think, as long as it is the right data. A handful of well-chosen stats per category beats a long list of loosely related ones, because each extra number is another chance to find support for what you already believe. Choose the stats that measure the thing the category is about and stop.
Be consistent about the window as well. If you use season averages for one team, use season averages for the other. Mixing a season figure for one side with a last-four figure for the other produces a gap that is just an artifact of the comparison. Put both on the same footing, then add a recent-form check as its own step.
Finally, keep a record. Writing down what you compared and why makes it much easier to see later which habits of yours add value and which just add noise.
What does the method look like on a made-up example?
Picture a football game, invented for illustration. The home team has the better quarterback numbers but gives up a lot of yards. The visitors have a quieter offense and a stingy defense, and they are playing on a normal week while the home team is on a short one.
Step one fixes the categories. Step two shows the home team ahead at quarterback and behind on defense. Step three sizes those gaps: perhaps a clear lead at quarterback, a modest deficit on defense, nothing much elsewhere. Step four brings in the short week, which trims the home team's margin, and the market, which you check as a cross-reference. Step five names the risk: if the quarterback is hurried, the whole edge shrinks.
Notice that nothing in this process required a prediction. It produced a structured opinion with a stated weak point, and that is a better foundation for any decision than a hunch.
What mistakes ruin a head-to-head comparison?
- Cherry-picking the stat that agrees with the side you already like.
- Comparing totals when the teams have played different numbers of games.
- Treating a tiny gap as a verdict. Under 5% is, by Betty's scale, Even.
- Ignoring who is actually available on game day.
- Letting recent results outweigh the whole season without a reason.
Does the method work in every sport?
The five steps do. The categories change. For football, start with the NFL six categories. For basketball, hockey and fights, the sport pages NBA, NHL and UFC show the category names in use.
Want to see it on a real game? Start free and open this week's featured matchup in any sport.
Betty Sports is for information only. Betty does not accept wagers. You must be 21 or older. If you or someone you know has a gambling problem, call 1-800-GAMBLER.
Frequently asked questions
- What is a head-to-head comparison in sports?
- It is a side-by-side look at two teams or fighters across the same set of measures, so you can see where each one is stronger. It differs from a past-meetings record, which only reports what happened when they last played.
- Do past meetings between two teams matter?
- They can add color, but rosters, injuries and form change, so older results say less than current stats. Use them as a minor input after you have compared the current categories rather than as a deciding factor.
- How many stats should I compare?
- Fewer than you think. Choose a handful of categories that decide the sport and compare the same ones every time. Dozens of stats make it easy to find support for whatever you already believe.
- Can I compare two teams for free on Betty?
- Yes. The Free plan fully unlocks one featured matchup per sport each week, including the category breakdown, the gap ratings and the AI-written summary. Betty Pro opens every matchup in every sport.