
NHL Head-to-Head Stats Explained: Goaltending, xG and More
By Betty Sports · · 7 min read
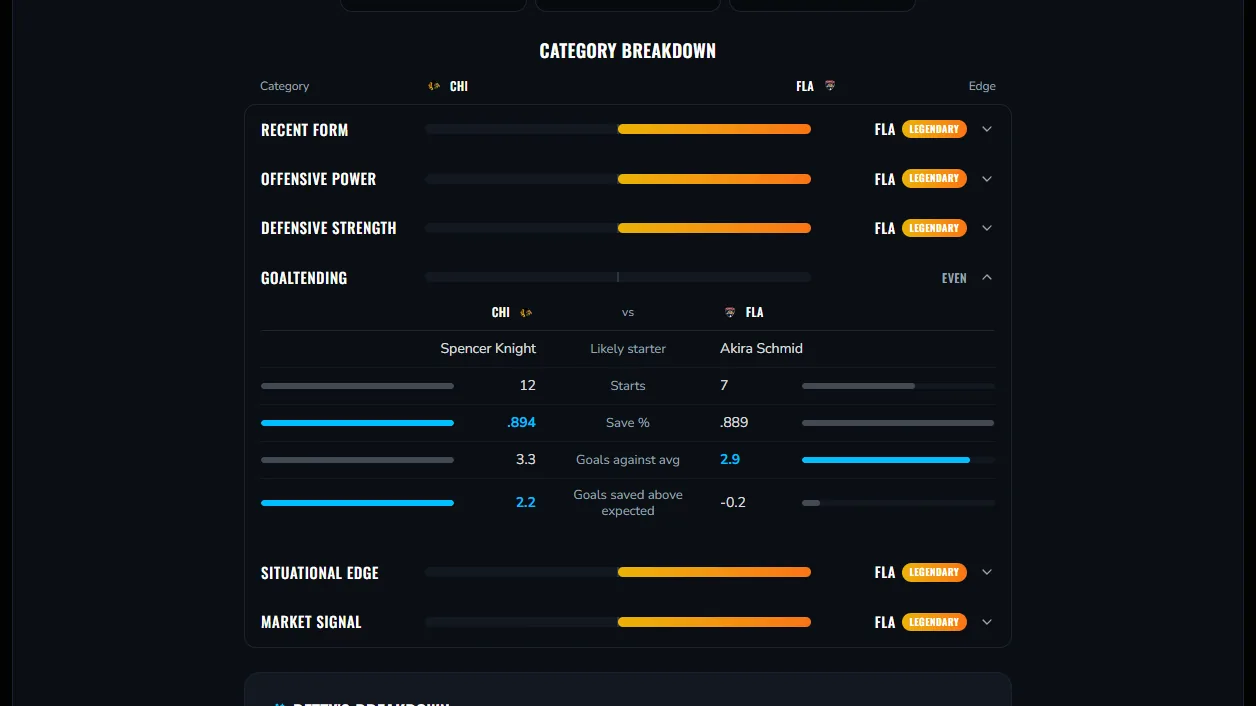
To compare two NHL teams head to head, look at six areas: recent form, offense, defense, goaltending, situational factors and the market. Hockey is low-scoring, so shot quality and the goaltender matter more than raw goal totals. Expected goals and goals saved above expected are the two stats that capture that.
Hockey is the sport where a single save, bounce or penalty can decide a game, which makes it tempting to dismiss the numbers. But the numbers still separate teams over time. Here is what each NHL category in Betty measures, what expected goals actually are, and how to avoid the biggest hockey traps.
What is Recent Form in the NHL?
Recent Form looks at the last ten and last five games and the current streak. It is first in Betty's NHL list because hockey results swing with short runs of goaltending and finishing. Check it against the other categories: a hot streak backed by good shot quality is more believable than one built on luck.
How do you compare Offensive Power?
Offensive Power uses goals per game, power play percentage and expected goals for per game. Goals tell you what happened. Expected goals tell you what the quality of the chances said should have happened.
MoneyPuck describes an expected goal as the probability that a given shot becomes a goal, estimated from inputs such as shot location and angle, shot type and the play that came just before it (its about page has the detail). Add up those probabilities over a game and you get a team's expected goals. A team scoring well above its expected goals is probably running hot and may cool off.
What does Defensive Strength include?
Defensive Strength covers goals against, shots against and expected goals against per game, plus penalty kill percentage. The penalty kill is worth watching because special teams create a large share of swing moments in a game.
Look for gaps between goals against and expected goals against. A team that gives up few goals but many dangerous chances may be getting rescued by its goaltender, and that is not a stable plan.
Why is Goaltending its own category?
Because no other position swings a hockey game as much. Betty compares the likely starters on starts, save percentage, goals against average and goals saved above expected.
Goals saved above expected compares the goals a goalie actually prevented with how many the quality of shots faced should have produced, so a positive figure means the goalie is outperforming the chances. It is a better lens than save percentage alone because it accounts for shot difficulty. Treat all of it with care: goalie numbers are noisy, and the likely starter can change late.
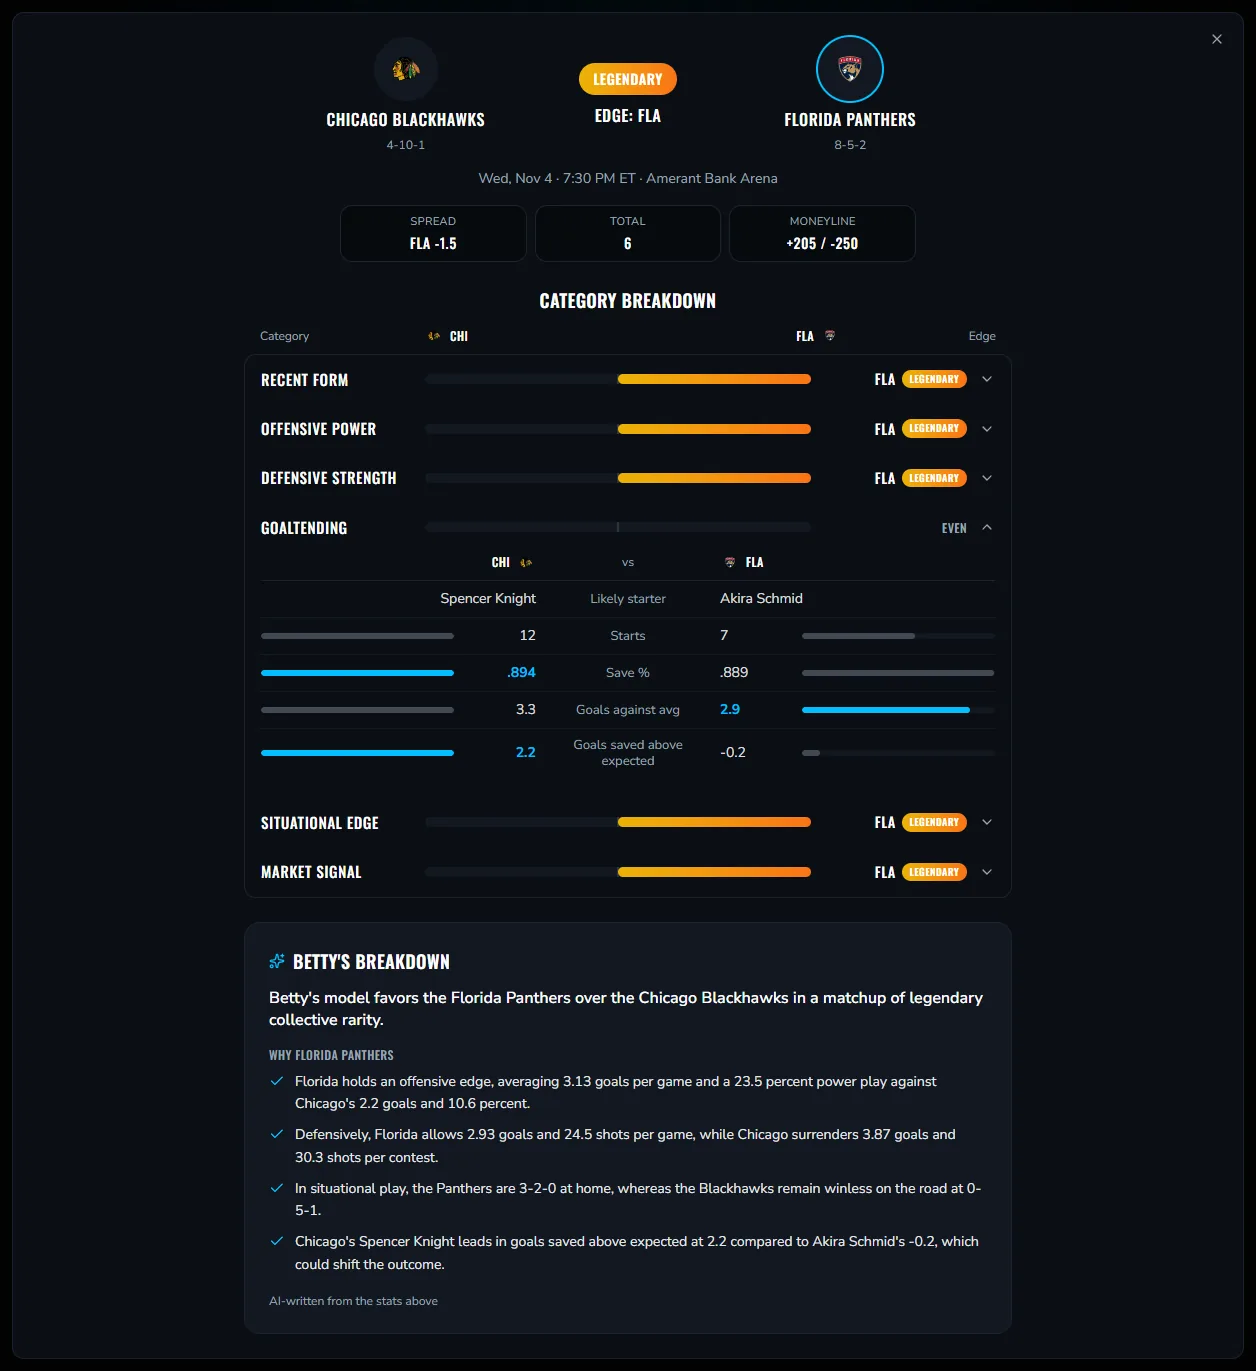
An example from the screenshot above makes the point: the goaltending row can read Even while other rows show big gaps, which tells you the game is unlikely to hinge on the crease.
What counts as Situational Edge in hockey?
Situational Edge covers the context of one game: season record, home and road record, days of rest and back-to-back status. Teams on the second night of a back-to-back often have less in reserve, and a long homestand is a different test from a road trip. Rest is also why the starting goalie can change, so check it near game time.
How should you read Market Signal?
Market Signal covers the moneyline, the total and how they moved. It is a read from other people with money on the line and sometimes information you lack, such as a goalie news item. Use it as a cross-check on your comparison, not as the comparison.
How do shot volume and shot quality fit together?
Shot volume says how often a team gets to the net, and shot quality says how dangerous those looks are. Betty includes shots against per game and expected goals against alongside goals against so you can see both. A team that allows many shots but few dangerous ones can look worse on volume than it really is, and a team that allows few shots but all of them from close range may be more exposed than the shot count suggests.
The cleanest signal is agreement. When goals, shots and expected goals all point the same way, a team's results are probably earned. When they disagree, the team is either running hot or running cold, and results tend to drift back toward the underlying chances.
That is worth keeping in mind when reading Recent Form. A winning streak with a poor expected-goals profile is a streak to be skeptical about.
How should you handle a goalie change?
Check the likely starter as close to game time as you can. Goaltending is the one category where a single announcement can reshape the comparison, because a backup may have very different numbers from the regular starter. If the starter changes after you have read a matchup, revisit the goaltending row and the summary that depends on it.
Why do special teams matter so much in a low-scoring sport?
When goals are scarce, every power play is a larger share of the scoring chances. Betty includes power play percentage in offense and penalty kill percentage in defense so that special teams are not lost inside the totals. A team that is strong at even strength but weak on the penalty kill can look better in the standings than it is against a team that draws penalties.
As with every category, the useful question is the cross-over: one team's power play against the other's penalty kill.
How do the six categories roll up?
Betty rates each category gap from Even to Legendary and weights them into one collective verdict. Because hockey outcomes are noisy, a Legendary gap here still describes the stats, not the final score. The tier scale is covered in what Legendary, Epic and Rare mean, and the broader process in the five-step head-to-head method.
What are the biggest NHL comparison traps?
- Trusting goals against without checking shot quality.
- Treating a hot goalie as a permanent upgrade.
- Ignoring special teams in a low-scoring game.
- Forgetting who is actually starting in net tonight.
- Reading a small gap as a finding.
Want to see all of this on a real slate? Open the NHL matchups page. The Free plan fully unlocks one featured NHL matchup each week, so start free and expand the goaltending row yourself. Betty's hockey data comes from the NHL API.
Betty Sports is for information only. Betty does not accept wagers. You must be 21 or older. If you or someone you know has a gambling problem, call 1-800-GAMBLER.
Frequently asked questions
- What are the six NHL categories on Betty?
- Recent Form, Offensive Power, Defensive Strength, Goaltending, Situational Edge and Market Signal. Each category compares both teams on related stats and rates the gap from Even to Legendary.
- What does expected goals mean?
- It is a measure of shot quality. Each shot gets a probability of becoming a goal based on factors like location and shot type, and the probabilities add up to a team's expected goals. It shows whether a team's scoring matches its chances.
- What is goals saved above expected?
- It compares the goals a goalie actually stopped with the number the difficulty of the shots faced should have produced. A positive number means the goalie is outperforming the chances, which can be real skill or a hot streak.
- Does Betty tell me which NHL team to bet?
- No. Betty shows which team has the statistical edge and why. It does not pick bets, accept wagers or promise any result.