
NBA Head-to-Head Stats: What to Compare Before Tip-Off
By Betty Sports · · 7 min read
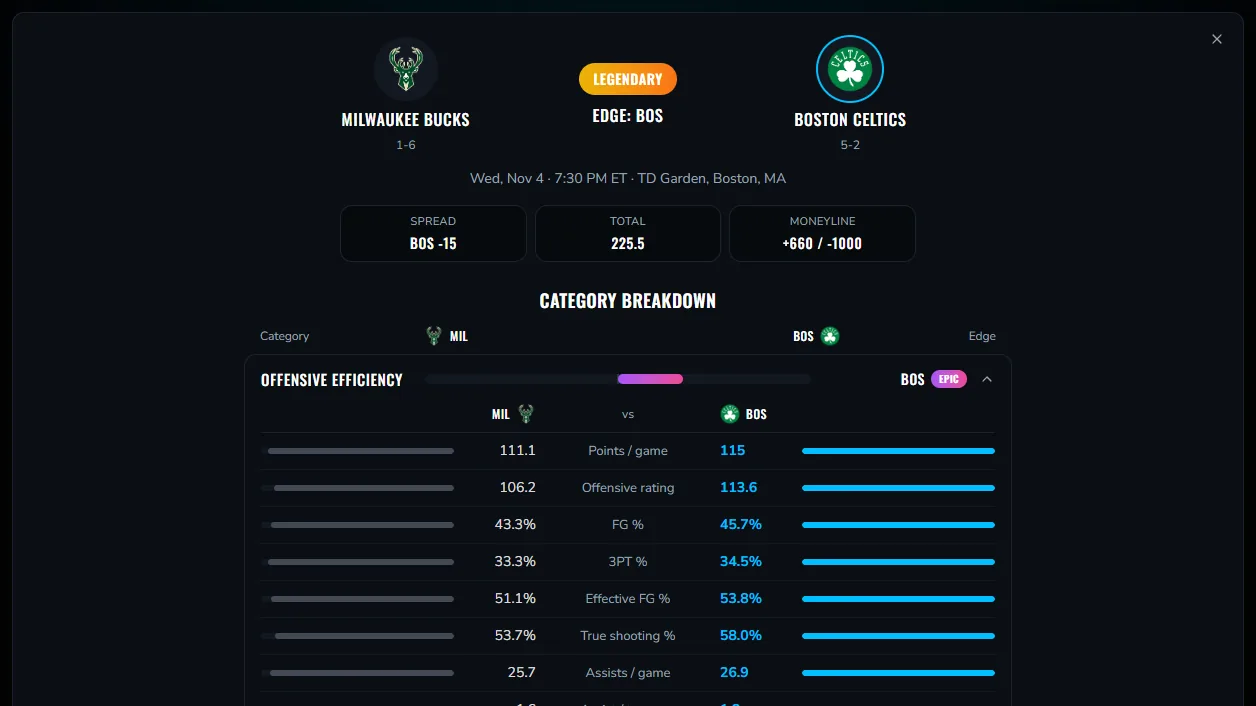
For NBA head-to-head stats, compare six things: offensive efficiency, defensive efficiency, rebounding and possession, rest and schedule, recent form and the market. Efficiency stats beat raw points because they adjust for how many possessions a team gets, which is what makes two teams comparable.
Basketball hands you a huge pile of numbers every night. The trick is knowing which ones answer the question of who has the advantage in this particular game. This guide walks through the six NBA categories Betty uses, the stats inside each, and the traps in reading them.
Why do efficiency stats matter more than points per game?
Points per game rewards teams that play fast. Efficiency asks how well a team uses each possession. A slow team that scores well per possession can look unimpressive in a box score and still be strong.
Basketball-Reference defines pace as an estimate of possessions per 48 minutes, and offensive and defensive rating as points scored or allowed per 100 possessions. Those two ideas, a per-possession lens and a pace adjustment, run through everything below. See the Basketball-Reference glossary for the exact definitions.
What goes into Offensive Efficiency?
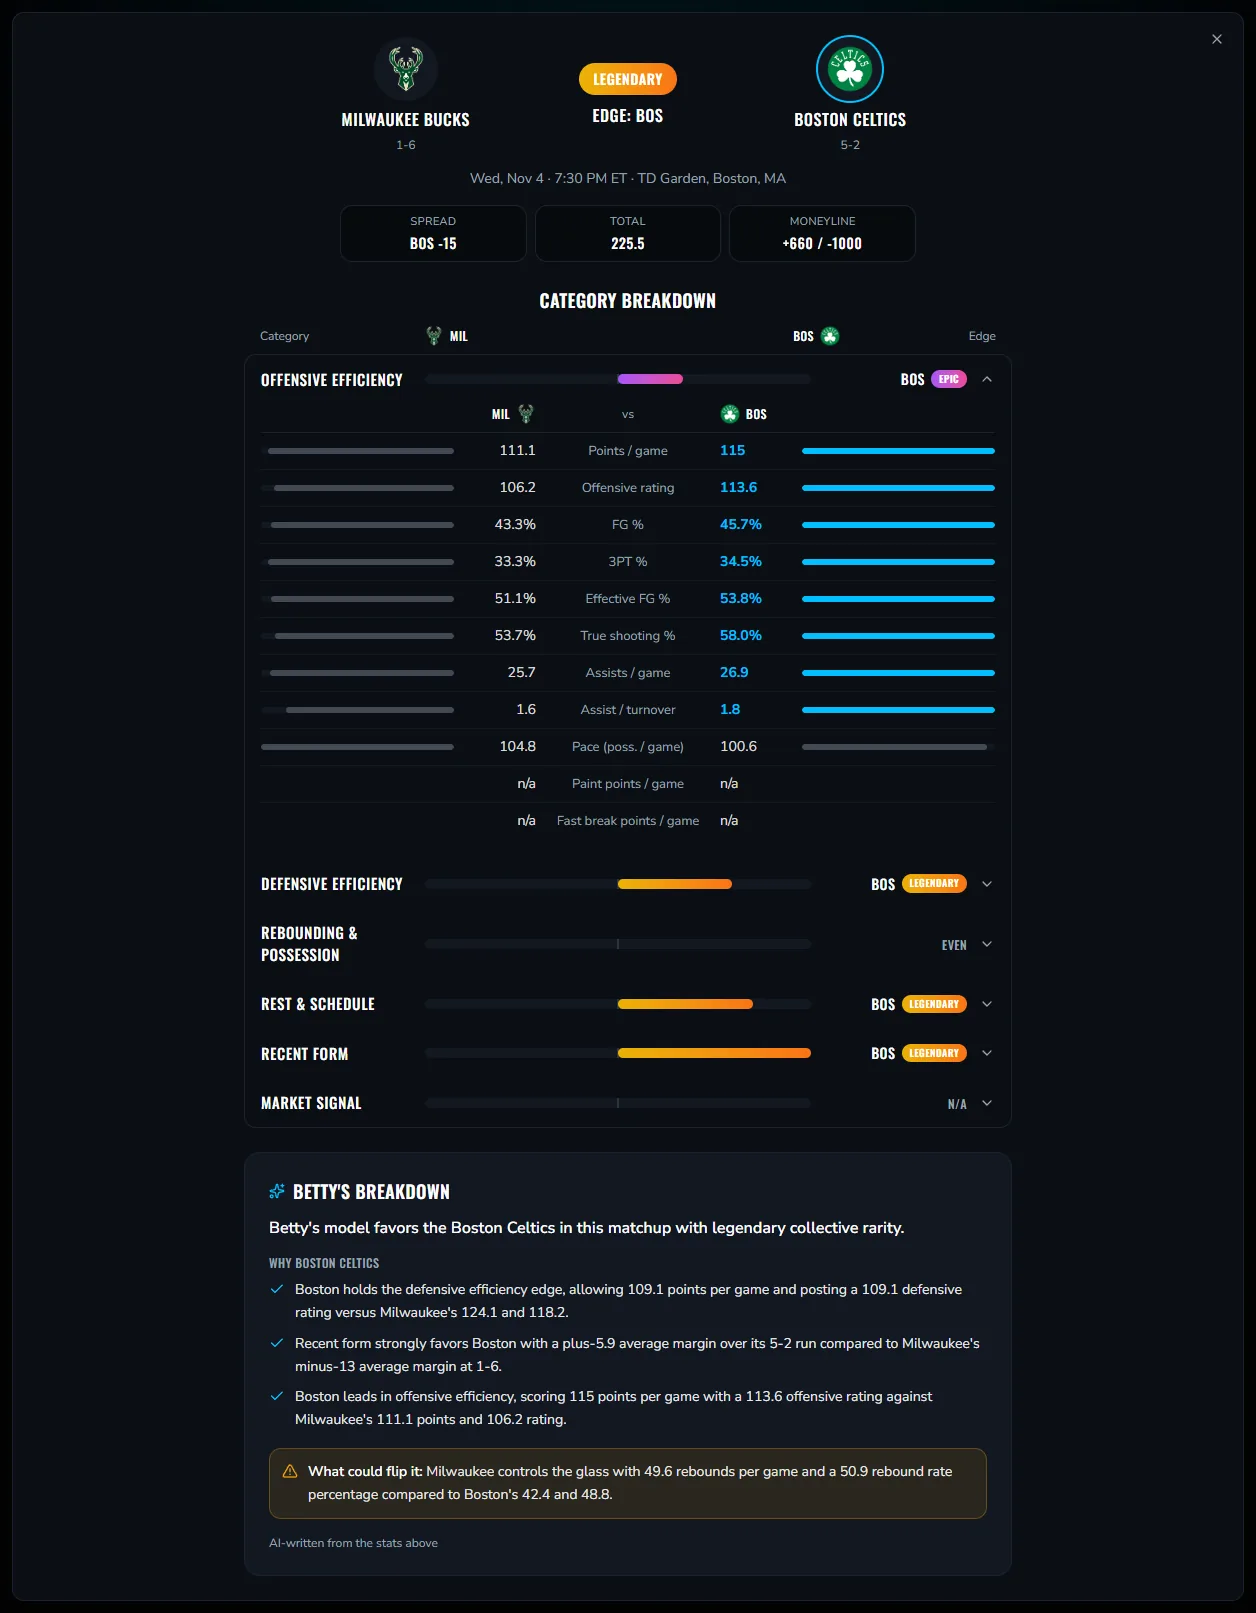
Offensive Efficiency in Betty combines scoring and shot quality: points per game, field goal percentage, three-point percentage, effective field goal percentage, true shooting percentage, assists per game and pace.
The two stats to understand are the shooting-efficiency ones. Effective field goal percentage gives a made three extra credit because it is worth more than a two. True shooting percentage goes further and folds in free throws, so it captures scoring efficiency in a single number. Both are defined on the glossary linked above. When field goal percentage and effective field goal percentage disagree a lot, a team is living on threes, which can swing from night to night.
What does Defensive Efficiency add?
Defensive Efficiency measures how well a team limits the other side, and it includes disruption stats such as steals and blocks per game. Defense is harder to see in a box score, so group stats beat any single number.
When you compare, pair each team's offense with the opponent's defense. A great offense against a weak defense is a different proposition from the same offense against an elite one, and offense-against-offense comparisons miss that.
How do Rebounding and Possession decide close games?
Extra possessions are free scoring chances. The Rebounding & Possession category covers rebounds per game, rebound rate and turnover ratio. Rebound rate is the share of available rebounds a team grabs, which is more informative than a raw count because it adjusts for how many misses there were.
Turnovers are the other half. A team that wins the rebounding battle and also protects the ball creates more shots than its opponent over a game, and that shows up even when shooting percentages look close.
Why is Rest & Schedule an NBA category?
Because the NBA schedule is dense. Betty's Rest & Schedule row looks at days of rest and whether a team is on the second night of a back-to-back, alongside records and venue context such as a neutral site.
Rest is an overlay on the other categories rather than a substitute for them. A team with a clear edge in efficiency on a back-to-back is still the better team on paper, but the gap may be smaller than season stats suggest.
What does Recent Form show?
Recent Form tracks the last ten games and the current streak. It is a check on whether season-long numbers still describe the team, which matters after trades, injuries or lineup changes. Be careful with small samples: ten games is a trend to watch, not a conclusion.
How should you use Market Signal?
Market Signal reads the moneyline and total, including how they opened versus where they are. Treat it as evidence from the market rather than a verdict. If your stat comparison and the market point the same way, that is reassuring. If they disagree, find out why, since the market may know about an injury the season stats do not.
How do you read NBA stats without overreacting?
Be patient with shooting percentages. Three-point shooting in particular swings from game to game, so a team shooting far above or below its norm is likely to drift back toward it. That is why Betty places effective and true shooting percentages beside the raw figures, and why it is worth comparing a team's recent form with its season line before drawing a conclusion.
Treat counting stats such as points, assists, steals and blocks as descriptions of style as much as quality. A team that forces many steals may be gambling in passing lanes, and a team with high assist totals may simply move the ball a lot. Neither is automatically good or bad until you see how it feeds efficiency.
Finally, compare roster reality with the numbers. Season stats include games with players who may no longer be available, so the most recent lineup information is always worth checking before you rely on a gap.
How do you compare teams that play at different speeds?
Use per-possession stats first. A fast team and a slow team will produce very different raw totals even if they are equally good, so offensive and defensive efficiency, and rebound rate rather than rebounds, put them on the same footing. Pace itself is worth a look as a matchup factor: it tells you whose style is likely to dominate the tempo of the game.
What should you check on game day?
- Who is actually available, since a missing starter can change a team's efficiency numbers.
- Whether either team is on a back-to-back or at the end of a road trip.
- How the moneyline and total have moved since they opened.
- Whether the recent-form record reflects the current rotation or an earlier one.
None of these changes the method. They are the late information that decides whether the season-long comparison still describes tonight.
How do these categories fit together on one screen?
Betty rates the gap in each of the six rows and combines them into one collective verdict. The ratings run Legendary, Epic, Rare and Even, and the tier guide shows how to read them. For a sport-agnostic process, use the five-step head-to-head method.
To compare real teams, open the NBA matchups page. Free accounts get one fully unlocked featured NBA matchup each week, so start free and look at the rows yourself.
Betty Sports is for information only. Betty does not accept wagers. You must be 21 or older. If you or someone you know has a gambling problem, call 1-800-GAMBLER.
Frequently asked questions
- What are the six NBA categories on Betty?
- Offensive Efficiency, Defensive Efficiency, Rebounding & Possession, Rest & Schedule, Recent Form and Market Signal. Each group contains related stats, and the gap in each is rated from Even to Legendary.
- Is effective field goal percentage better than field goal percentage?
- It is usually more informative because it gives extra credit for made three-pointers, which are worth more than twos. Comparing the two numbers for a team also shows how much it relies on threes.
- How much does a back-to-back matter?
- It can shrink a team's edge, but the size varies by team and game. Betty treats rest as its own category so it is visible rather than hidden inside other stats.
- Does Betty show NBA games for free?
- Free accounts unlock one featured NBA matchup each week with the full breakdown. Betty Pro opens every NBA game and every game in the other sports.